New High Tide Flooding 2016 Update and 2017 Outlook
NOAA’s Center for Operational Oceanographic Products and Services has recently produced the annual update of the state of coastal high tide flooding. This year’s report highlights tidal flooding during the 2016 meteorological year and compares it to the trend at 28 NOAA tide stations around the United States, which have collected data for more than 50 years. It also provides an experimental outlook for the 2017 meteorological year, taking into account the possible development of El Nino conditions.
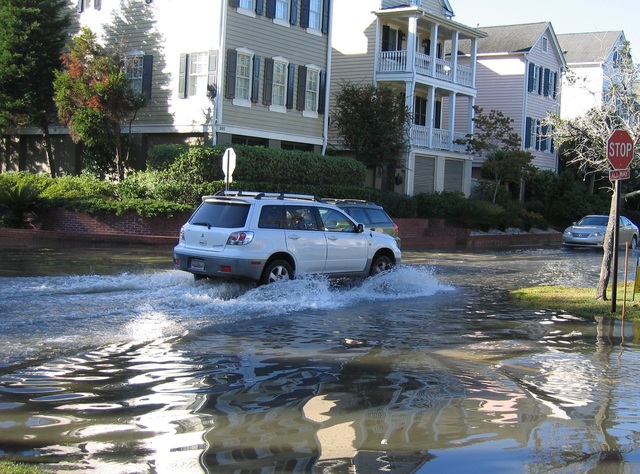
Decades ago, coastal flooding mostly occurred during strong storms. Today, it occurs more frequently during high-tide cycles and calmer weather. Sometimes called nuisance or sunny day flooding, this type of flooding occurs when water levels measured at NOAA tide gauges exceed locally established heights associated with minor impacts, such as water on low-lying streets or infiltration into storm-water systems.
Though high tide flooding today is rarely life threatening, it is a serious concern in several communities, such as Norfolk, Virginia, Charleston, South Carolina and Miami, that are not protected by flood control structures that cities like New Orleans have in place. Such coastal flooding is increasing in frequency, depth and extent in many areas of the U.S. due to on-going increases in local relative sea level.
- Several cities experienced more than a month (30 days) of daily flooding in 2016: Wilmington, NC (84 days); Charleston, SC (50 days); Honolulu, HI (45 days); Annapolis, MD (42 days); Savannah, GA (38 days); Washington D.C. (33 days); and Port Isabel, TX (31 days) due to a combination of low-lying coastal topography and high sea levels during 2016.
- Compared to the number of flood days during 2015 (4 days), Honolulu experienced a more than a 1,000 percent increase during 2016 (45 days).
- Charleston (50 days) and Savannah, GA, (38 days) broke their historical record for days with high tide flooding during 2016; Key West, FL, (14 days) tied its record.
- In most locations, the number of days with high tide flooding during 2016 exceeded national historical trends established over recent decades; annual trends are accelerating in 19 out of 28 locations examined.
- Compared to 1995, trends in flooding during 2016 have increased by 130 percent on average, ranging from 30 to 270 percent.
- Due to the possible development of El Nino conditions, the 2017 projections for high tide flooding are 25 percent higher on average than trend values at several East and West coast locations.
Find the complete coastal flooding report at https://www.ncdc.noaa.gov/monitoring-content/sotc/national/2017/may/2016_StateofHighTideFlooding.pdf.