Frequently Asked Questions
- I can only get a short time period of data from your website and data services. How can I get a longer time series of data?
- What is the relationship between NAVD88 and the tides at my location?
- What is the difference between "Tide Charts" and "Tide Tables" or “Current Charts” and “Current Tables”?
- What is the relationship between “Tides” and “Tidal Currents”?
- What are the “Perigean Spring Tides” or “King Tides”? Do they cause coastal flooding?
- Are there tides in the Great Lakes?
- Where can I find information on the 100-year, and 10-year tide levels?
- Where are the highest tides?
- It appears that the range of tide gets larger the further the location is from the equator. What causes this?
- Where are the fastest tidal currents?
- Where can I get information on the Gulf Stream?
- How accurate are the tide predictions?
- Where can I get predictions (tides or currents) for locations outside the United States?
- How can I get a copy of the NOAA computer programs used to make tide / current predictions?
- I want to generate an application to generate predictions. What information is available to help me?
- How do I obtain the published books with the Tide and Tidal Current Predictions?
All of our online data services have limitations on the amount (length) of data which can be retrieved through a single data query. These limitations are necessary to prevent large data requests from slowing or preventing data access to our customers.
The data length limitation are based on the interval of the data being retrieved.
- 6-Minute interval data is limited to 1 month
- Hourly interval data is limited to 1 year
- Daily Means (Great Lakes only) is limited to 10 years
- High/Low Tides or Max/Min currents are limited to 1 year
- Monthly Means water level data is limited to 200 years
There are no exceptions to these limitations.
The only available means to retrieve a longer data series of data would be to use one of the Web Services which we offer to retrieve data using a query system, and repeat that query as needed in order to compile the length of data required.
NOAA, and it predecessor organizations, have been measuring tide data long before the development of a standard geodetic datum, such as NAVD1988. Where possible we provide a relationship between tidal datums and the geodetic datum of NAVD1988. This relationship is noted on the Tidal Datums for that station, by providing an elevation of NAVD88. If that field is blank, then no relationship has been established.
Our standard requires a minimum of 2 survey benchmarks, installed within a short distance of the station, which have a NAVD88 elevation recorded by the National Geodetic Survey (NGS). The survey benchmarks associated with each station are provided in the Benchmark Sheets for a station. If the individual benchmark has a NGS record, this is recorded by the IDP or OPUS PID numbers of that mark. When survey leveled from these markers to the tide station, the relationship calculations for these marks must match within 9 millimeters.
Unfortunately, not all stations are able to meet these standards. Many stations, particularly older or temporary stations, lack the survey benchmarks necessary to establish the relationship between tidal and geodetic datums.
In which case, there is one additional option available - the Vertical Datum Transformation (VDATUM) tool. VDATUM is a free software tool and online service developed jointly by NOAA's National Geodetic Survey (NGS), Office of Coast Survey (OCS), and Center for Operational Oceanographic Products and Services (CO-OPS). VDatum uses modeling techniques to calculate a relationship between tidal and geodetic datums at a desired location, based on the near-by locations with a measured relationship between tidal and geodetic datums.
"Tide Charts" and "Tide Tables" are two different products, as are “Current Charts” and “Current Tables”.
"Tide Charts" refer to a series of maps that show the water levels throughout a bay or estuary at a particular point in time. NOAA has never produced a printed tide chart publication.
“Current Charts” refer to a series of maps that show the currents speed and direction throughout a bay or estuary at a particular point in time. These maps normally show the currents (speed and directions) on an hourly basis. NOAA used to provide printed Tidal Current Charts for 9 areas of the U.S. coastline. However those publications were removed in 1990 due to inaccurate information presented in these publications.
The only “Tide Charts” and “Current Charts” presently generated are the Water Level or Currents – Nowcast & Forecasts Guidance available from our Operational Forecast Systems (OFS).
"Tide Tables" refer to tidal predictions tables, which provide a listing of the times and heights of the daily high and low tide predictions, or hourly interval tidal height values, for a particular location. "Tide Tables" can be generated for more than 3,000 locations around the USA, and are available from the NOAA Tide Predictions service of our website.
"Current Tables" refer to tidal current predictions tables, which provide a listing of the times and speeds of the daily flood, ebb, and slack currents, or hourly interval currents speeds, for a particular location. "Current Tables" can be generated for more than 2,500 locations around the USA, and are available from the NOAA Current Predictions service of our website.
The term “Tide Tables” and “Current Tables” were also used to refer to the series of annually published NOAA Tide Tables / Current Tables books. These books provided tide or current predictions for a wide variety of locations, and included tide predictions for international locations provided by the Oceanographic agencies in those countries. These printed tables were produced annually from 1867 until 2020.
The vertical rise and fall of the tides, created by the gravitational force of the Moon and Sun acting on the oceans water, also creates a horizontal motion of the water in the bays, harbors and estuaries. These are tidal currents. In general, as the tides rise there will be a current flowing from the oceans into the bays, harbors and estuaries; this is termed a "flood current". As the tides fall, there will be a current flowing toward the oceans; this is termed an "ebb current". There are also periods when there is little or no horizontal motion of the water; this is called "slack water".
Many professional and recreational users of tide and tidal current information have a "rule of thumb" to assume a relationship between the times of high/low tides and the times of the currents: that the times of slack water will be at the same time as the high and low tides, and that the flood and ebb current will occur between the high and low tides. Unfortunately, this assumed "rule of thumb" does not hold for most locations.
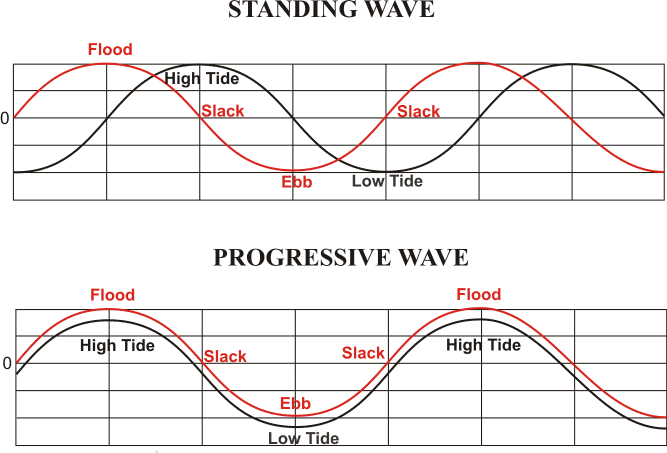
The relationship between the times of high/low tide and the times of slack water or maximum current is not a simple one. There are three "base case" conditions. The first is a "standing wave" type of current. In a standing wave, the times of slack water will be nearly the same time as the high and low tides, with the maximum flood and ebb current occurring mid-way between the high and low tides. The second is a "progressive wave" current. In a progressive wave, the maximum flood and ebb will occur around the times of the high and low tides, with the slack water occurring between the times of high and low tide. The third case is a "hydraulic current". In a hydraulic current, the current is created by the difference in height of the tides at two locations joined by a waterway. The current will be at its maximum flood or ebb when the difference in the two heights are the greatest. The slack water will occur when the height of the tide at the two locations in nearly the same.
Hydraulic currents occur at a limited number of locations. Some examples would include:
- Chesapeake and Delaware Canal, which connects Chesapeake Bay and Delaware Bay
- Cape Cod Canal, which connects Cape Cod Bay and Buzzards Bay
- East River in New York, which connects Long Island Sound to New York Harbor
- Certain sections of the Intra Coastal Water Way (ICWW)
- Between barrier islands which create different tidal conditions on opposite sides of the island
Progressive currents are most common at the oceanic entrance to many bays and harbor. Standing wave conditions are most common at the head (most inland point) of larger bays and harbors. Most areas of the coast will fall somewhere in between a progressive and standing wave current. [See example here (jpg)] The exact relationship between the times of high and low tides and the maximum current or slack water is unique to each location and cannot be determined from a generic "rule of thumb".
![[See example here (jpg)]](/images/tidevscurrentstjohns.jpg)
Because the tidal currents are created by the same forces which cause the tides, the currents can be predicted in much the same way as the tides. Observational data on the currents at a location can be analyzed using the same methods employed to analyze tides, and the results of that analysis can be used to generate predictions of tidal currents. However, because the relationship between tides and tidal currents is unique to each location, tide predictions and tidal current predictions are generated separately.
- Tide predictions provide the times and heights of the tides, available from the NOAA Tide Predictions service
- Tidal current predictions provide the times and speed of maximum current and times of slack water, available from the NOAA Current Predictions service.
It is up to the customer to use the correct type of predictions for their activities.
The Moon is the primary source of the gravitational forces which create the tides; the Sun’s gravitational force also plays a role.
Twice each month, the Earth, Moon, and Sun are aligned and create the New Moon and the Full Moon. During these periods, the combined gravitational force creates a larger than average range of tides (the high tides are higher and low tides are lower). These are called the “spring tides”.
The proximity of the Moon to the Earth also has an effect on the range of the tides. Once during each of the Moon’s 28-day elliptical orbits, the Moon is at the closest point of approach to the Earth; it is at “perigee” and the range of tides is a larger than average.
Between 6 and 8 times per year, the New Moon/Full Moon (spring tides) coincide with the Moon being at perigee to create “Perigean Spring Tides”. Popular media often refers to these as “King Tides”. The difference between Perigean Spring Tide and spring tides that occur closer to the moon’s apogee (when it is furthest from earth) are location dependent and significantly influenced by tidal range, but can be large. It is not uncommon for high tides during a perigean spring tide to be more than a foot higher than high tides during “apogean spring tides”. Along coastlines like the U.S. West Coast, the range of Perigean Spring Tides will be largest near times of the summer and winter solstices due to the added effect of the Earth's declination to the sun. Along the U.S. East and Gulf Coasts, the peak in the seasonal mean sea level cycle occurs in the late summer and early fall and increases the height of the Perigean Spring Tides, though it does not affect the mean tide range.
During Perigean Spring Tides, tide heights can exceed 0.5 feet or more above the average daily highest tide height (Mean Higher High Water – MHHW) and increase the localized risk of coastal flooding. Along U.S. coastlines, 'high tide flooding' generally begins to occur when water levels exceed 1.5 feet above MHHW. Thus in most coastal regions, high tide flooding will only occur if additional factors also cause coastal water levels to rise, such as changes in winds or currents.
Due to many decades worth of sea level rise, however, the probability of Perigean Spring Tides and/or typical weather effects causing high tide flooding is on the rise. Areas previously immune to flooding except during the strongest storms are beginning to experience high tide flooding more frequently, including during the Perigean Spring Tides.
The water levels of the Great Lakes have long-term, annual, and short-term variations. Long-term variations depend on the precipitation and water storage over many years. Annual variations occur with the changing seasons. There is an annual high in the late spring and low in the winter. These changes occur at a rate that can be measured in feet per month.
True tides, changes in water level caused by the gravitational forces of the sun and moon, do occur in a semi-diurnal pattern on the Great Lakes. The investigations of the U.S. Coast and Geodetic Survey indicate that the spring tide, the largest tides caused by the combined forces of the sun and moon, is less than 2 inches (5 cm) in height. These minor variations are masked by the greater fluctuations in lake levels produced by wind and barometric pressure changes. Consequently, the Great Lakes are considered to be non-tidal.
Other non-tidal factors may create quite large fluctuations of lake levels, but only for short periods of time lasting from minutes to several days. The two most dramatic are storm surge and seiche.
Storm surge is a sudden, and often unexpected, rise in lake level associated with a rapid change in atmospheric pressure, or a storm wind over a short period of time. If high winds are steady for a long period (e.g. several hours), a change in water level will occur known as wind set-up. Once the winds cease or shift direction, a standing wave called a seiche may occur. This is very similar to the wave created by sloshing water in a bathtub. The seiche will cause lake surface levels to oscillate from high to low levels with decreasing amplitude over a period of several days. It is this oscillating water level that is most often confused with a tide because the period of the oscillation in some of the Great Lakes is very similar to the period of the tides.
In summary:
- Water levels in the Great Lakes change not because of the tides, but because of meteorological effects imposed on the longer-term changes in the amount of water in the lakes.
- For present and historic levels in the Great Lakes, see CO-OPS Water Level Stations.
- For additional information on lake level changes, see the US Army Corp of Engineers Great Lakes Hydraulics and Hydrology webpage.
The CO-OPS Extreme Water Levels service provides the analysis of tidal data for more than 100 stations with greater than 30 years of data. This analysis includes calculations of the 1% (1 in 100-year), 10% (1 in 10 year), 50%, and 99% water level elevations for both high water and low water extremes.
The extreme levels measured by the CO-OPS tide gauges are a combination of the astronomical tide, the storm surge, and limited wave setup caused by breaking waves. They do not include wave run-up, the movement of water up a land slope.
Therefore, the 1% annual exceedance probability for high water levels shown on this website do not necessarily correspond to the Base Flood Elevations(BFE) defined by the Federal Emergency Management Administration (FEMA), which are the basis for the National Flood Insurance Program. The 1% annual exceedance probability levels on this website more closely correspond to FEMA's Still Water Flood Elevations (SWEL).
Below is a listing of 50 locations from around the world where the largest range of tides, the difference between low (MLW) and high (MHW) tide, that have been observed.
| Station | Mean Range (feet) |
|---|---|
| Burntcoat Head, Minas Basin, Bay of Fundy, Nova Scotia | 38.4 |
| Horton Bluff, Avon River, Minas Basin, Bay of Fundy, Nova Scotia | 38.1 |
| Amherst Point, Cumberland Basin, Bay of Fundy, Nova Scotia | 35.6 |
| Parrsboro (Partridge Island), Minas Basin, Bay of Fundy, Nova Scotia | 34.4 |
| Hopewell Cape, Petitcodiac River, Bay of Fundy, New Brunswick | 33.2 |
| Joggins, Bay of Fundy, Nova Scotia | 33.2 |
| Leaf Lake, Ungava Bay, Quebec | 32.0 |
| Port of Bristol (Avonmouth), United Kingdom | 31.5 |
| Grindstone Island, Petitcodiac River, Bay of Fundy, New Brunswick | 31.1 |
| Spencer Island, Bay of Fundy, Nova Scotia | 30.5 |
| Newport, Bristol Channel, United Kingdom | 30.3 |
| Sunrise, Turnagain Arm, Cook Inlet, Alaska | 30.3 |
| Burnham, Parrett River, United Kingdom | 29.9 |
| Weston-super-Mare, Bristol Channel, United Kingdom | 29.5 |
| Rio Gallegos (Reduccion Beacon), Argentina | 29.0 |
| Koksoak River entrance, Hudson Bay, Canada | 28.5 |
| Herring Cove, Bay of Fundy, New Brunswick | 28.3 |
| Granville, France | 28.2 |
| Cardiff, Bristol Channel, United Kingdom | 28.1 |
| Leaf Bay, Ungava Bay, Quebec | 28.0 |
| Banco Direccion, Magellan Strait, Chile | 28.0 |
| Cancale, France | 27.8 |
| Bahia Posesion, Magellan Strait, Chile | 27.5 |
| Ile Haute, Bay of Fundy, Nova Scotia | 27.5 |
| Barry, Bristol Channel, United Kingdom | 27.1 |
| Hopes Advance Bay, Ungava Bay, Quebec | 27.0 |
| Spicer Cove, Chignecto Bay, Bay of Fundy, Nova Scotia | 27.0 |
| Iles Chausey, France | 26.9 |
| Port George, Bay of Fundy, Nova Scotia | 26.7 |
| Watchet, Bristol Channel, United Kingdom | 26.6 |
| Ria Coig, Argentina | 26.6 |
| St. Malo, France | 26.2 |
| Anchorage, Knik Arm, Cook Inlet, Alaska | 26.2 |
| Santa Cruz (Punta Quilla), Argentina | 26.0 |
| Punta Loyola, Argentina | 25.9 |
| Les Minquiers, Jersey, Channel Islands | 25.1 |
| Paimpol, France | 24.8 |
| Erquy, France | 24.6 |
| Binic, France | 24.4 |
| Le Legue entrance, France | 24.4 |
| Fire Island, Cook Inlet, Alaska | 24.4 |
| Cape Astronomicheski, Kamchatka, Russia | 24.1 |
| Cayeux, France | 23.8 |
| Cabo Virgenes, Argentina | 23.8 |
| Dungeness, Magellan Strait, Chile | 23.8 |
| Lezardrieux, France | 23.7 |
| St. Helier, Jersey, Channel Islands | 23.6 |
| Carteret, France | 23.6 |
| Ile de Brehat, France | 23.5 |
| Quaco Bay, Bay of Fundy, New Brunswick | 23.1 |
If you only consider a few locations, this may seem to be true; but it is not the case. Hundreds of locations in the extreme north and south latitudes have small tidal ranges, and a number of stations closer to the equator have large tidal ranges. For example, Korea is at roughly the same latitude as most of the U.S. coast. Numerous stations in Korea have a tidal range of more than 20 feet, most of the U.S. coast has a tidal range of 3-6 feet. A number of locations very near the equator which have a tidal range of 15-17 feet.
The tidal range of a particular location is dependent less on its position north/south of the equator than on other physical factors in the area; topography, water depth, shoreline configuration, size of the ocean basin, and others. For example, consider the southern coast of Alaska and British Columbia. The configuration of this coastline is very similar to a funnel, with the narrow end at Cook Inlet. This funnel shape means that the tidal water, spread across a large area in the ocean, gets concentrated in a much smaller area, and as the tide move into a more restricted area the heights increase. This leads to the large tidal ranges, 30+ feet, in the area of Cook Inlet. If you look at the tidal ranges for stations on the Bering Sea, outside this funnel but at the same latitude, you will find a tidal range of 5-7 feet.
Another factor affecting the tidal range is the size of the ocean basin in which the tides are located. The Pacific Ocean is, by far, the largest of the world's oceans. This means that the moon's gravity has a larger area of water on which to work; therefore, its effect tends to be greater. Compare this to stations in the Baltic Sea. Many tidal stations in the Baltic are as far north as any station in Alaska. However, due to the small size and shallow depth of the ocean basin, the tidal ranges in this area are relatively small.
We only have information for currents in the U.S. and Canada. Below is a list of the 50 locations in North America with the fastest tidal currents.
| Speed (knots) | ||||
|---|---|---|---|---|
| Station Name | Latitude | Longitude | Flood | Ebb |
| Seymour Narrows | 50 8.00N | 125 21.00W | 9.2 | 9.8 |
| Hole In The Wall, Okisollo Channel | 50 18.00N | 125 13.00W | 7.5 | 7.5 |
| Arran Rapids, north of Stuart Island | 50 25.00N | 125 8.00W | 7.0 | 7.0 |
| Surge Narrows, Okisollo Channel | 50 14.00N | 125 10.00W | 7.0 | 7.0 |
| Deception Pass, (Narrows) | 48 24.37N | 122 38.58W | 5.2 | 6.6 |
| Rapids, near Barnes Bay, Okisollo Channel | 50 19.00N | 125 16.00W | 6.5 | 6.5 |
| Race Point | 50 7.00N | 125 20.00W | 6.5 | 6.5 |
| Seechelt Rapids | 49 45.00N | 123 55.00W | 6.5 | 6.5 |
| Turn Point, Kootznahoo Inlet | 57 30.00N | 134 35.00W | 6.9 | 6.1 |
| Whirlpool Rapids, Wellbore Channel | 50 27.00N | 125 47.00W | 6.0 | 6.0 |
| South Inian Pass | 58 13.00N | 136 21.00W | 3.5 | 6.0 |
| Root Point, Chatham Channel | 50 35.00N | 126 12.00W | 5.5 | 5.5 |
| Akutan Pass | 54 1.00N | 166 3.00W | 5.8 | 5.3 |
| Unalga Pass | 53 57.00N | 166 12.00W | 6.3 | 5.3 |
| Derbin Strait | 54 6.00N | 165 14.00W | 5.8 | 5.3 |
| Pablo Creek bascule bridge | 30 19.40N | 81 26.30W | 3.4 | 5.2 |
| Dodd Narrows | 49 8.00N | 123 49.00W | 4.8 | 5.2 |
| Whale Passage, off Bird Point | 57 55.00N | 152 48.00W | 4.4 | 5.2 |
| Race Passage | 50 23.00N | 125 53.00W | 4.8 | 5.2 |
| Current Passage | 50 25.00N | 125 54.00W | 4.8 | 5.2 |
| Beardslee Island, West of, Glacier Bay | 58 28.00N | 136 2.00W | 5.3 | 5.1 |
| North Inian Pass | 58 17.00N | 136 23.00W | 2.9 | 5.1 |
| Shell Point, Blind Channel | 50 26.00N | 125 31.00W | 5.0 | 5.0 |
| Green Point Rapids, Cordero Channel | 50 27.00N | 125 31.00W | 5.0 | 5.0 |
| Orange Point | 50 4.00N | 125 17.00W | 5.0 | 5.0 |
| Yuculta Rapids, SW of Stuart Island | 50 21.00N | 125 9.00W | 5.0 | 5.0 |
| Off Cape Mudge | 50 0.00N | 125 14.00W | 5.0 | 5.0 |
| Sergius Narrows | 57 24.42N | 135 37.87W | 6.3 | 4.9 |
| Baby Pass | 53 59.00N | 166 4.00W | 4.2 | 4.8 |
| Tuck Narrows, Prince Rupert Harbor | 54 24.00N | 130 15.00W | 5.2 | 4.8 |
| Little Gull Island, 1.1 miles ENE of | 41 13.10N | 72 5.10W | 4.0 | 4.7 |
| west of, off 75th Street | 40 46.00N | 73 57.00W | 3.8 | 4.7 |
| Porlier Pass | 49 0.65N | 123 35.50W | 4.3 | 4.7 |
| Hell Gate (off Mill Rock) | 40 46.70N | 73 56.30W | 3.4 | 4.6 |
| Cape Cod Canal, railroad bridge | 41 44.50N | 70 36.80W | 4.0 | 4.5 |
| Masset Harbor, 5 miles Inside | 54 1.00N | 132 10.00W | 4.0 | 4.5 |
| Nobles Island, north of | 43 6.00N | 70 46.00W | 3.6 | 4.4 |
| West Foreland, 1 nmi. east of | 60 44.35N | 151 38.50W | 3.6 | 4.4 |
| Cairn Point, northwest of (east side) | 61 16.03N | 149 54.05W | 3.2 | 4.4 |
| Sand Island Tower, southeast of | 46 15.17N | 123 59.45W | 3.0 | 4.4 |
| Spike Rock | 56 36.06N | 132 58.56W | 4.7 | 4.3 |
| South Ledge | 56 37.00N | 132 58.00W | 4.7 | 4.3 |
| Middle Ground Shoal, southeast of | 60 50.75N | 151 20.20W | 3.4 | 4.3 |
| McGowan, SSW of | 46 14.37N | 123 54.92W | 1.7 | 4.3 |
| Tlevak Narrows, Turn Point, east of | 55 15.87N | 133 7.33W | 3.0 | 4.3 |
| Jones Point, Bagaduce River | 44 25.55N | 68 45.50W | 4.2 | 4.2 |
| West Foreland, 4 nmi. east of | 60 43.25N | 151 33.60W | 4.1 | 4.1 |
| Lituya Bay entrance | 58 37.00N | 137 40.00W | 5.1 | 4.1 |
| South Passage | 58 14.00N | 136 6.00W | 2.3 | 4.1 |
The Gulf Stream is an ocean current in the western North Atlantic Ocean that is a major component of the circulation of the water in this ocean basin. It flows generally northward along the U.S. East Coast from Florida to North Carolina. The current then turns toward the northeast, away from the ¬U.S. coast in the area of Cape Hatteras, NC, continuing up to Newfoundland, before moving across the north Atlantic to the west as the North Atlantic Current. It is an important part of the circulation of the Atlantic Ocean.
Knowledge of the position of the Gulf Stream is important to fishermen, weather forecasters, U.S. Coast Guard search-and-rescue operations, and many others. Changes in the position and speed of the Gulf Stream are caused by environmental rather than astronomical effects. NOS does not have observations or predictions available for the Gulf Stream.
Gulf Stream analysis and position information is available from a variety of scientific websites, among them:
The accuracy of the tide predictions is different for each location. Periodically, we do a comparison of the predicted tides versus the observed tides for a calendar year. The information generated is compiled in a Tide Prediction Accuracy Table. We work to ensure that the predictions are as accurate as possible. However, we can only predict the astronomical tides; water level changes created by the gravity of the Moon, and the relative motions of the Earth, Sun and Moon. We cannot predict the effect that wind, rain, freshwater runoff, and other short-term meteorological events will have on the tides.
In general, predictions for stations along the outer coast are more accurate than those for stations farther inland; such as along rivers, or inbays or other estuaries. Inland stations tend to have a stronger non-tidal influence; that is, they are more susceptible to the effects of wind and other meteorological effects than stations along the outer coast. An example of an inland station that is difficult to predict is Baltimore, Maryland. This station is located at the northern end of Chesapeake Bay. Winds that blow along the length of the bay have been known to cause water levels to be 1-2 feet above or below the predicted tides.
Stations in relatively shallow water, or with a small tidal range, are also highly susceptible to meteorological effects, and thus, difficult to accurately predict. At these stations, short-term weather events can completely mask the astronomical tides. Many of the stations along the western Gulf Coast fall into this category. An example is Galveston, Texas. This station is in a bay that is relatively shallow and has a small opening to the sea. At this station it is possible for meteorological events to delay or accelerate the arrival of the predicted tides by an hour or more.
NOAA's Center for Operational Oceanographic Products and Services (CO-OPS) has limited ability to provide tide predictions for locations outside the U.S. and U.S. territories. All of the locations we can provide predictions for are included in the:
- NOAA Tide Predictions service
- NOAA Current Predictions service
For other international locations, customers will need to contact the agency in that country which is responsible for tide and currents information and data. The International Hydrographic Organization provides contact information for such agencies in more than 100 countries in the annual IHO Yearbook.
Our office offers copies of the programs which are used to make predictions for harmonic stations.
- The tide predictions program is National Tide Predictions (version 4) (NTP4)
- The current predictions program is National Current Predictions (version 2) (NCP2)
However, our office is not in the business of software development and distribution. The programs we use were developed for our internal use and are not user-friendly. These programs are written in FORTRAN, and requires the use of a separate control file for each location that predictions are being made for. This control file must be altered each time you want to make tide predictions for different time periods. The programs are executed using a command line prompt.
A copy of either of these prediction programs, or information about the fees, may be requested by calling our office at (301) 713-2815 between 7AM-3PM Eastern Time.
You can also submit a request for a copy of the program by sending an e-mail to our address: Tide.Predictions@noaa.gov.
If you elect to submit your request via e-mail, include the following information:
- Your Full Name
- Your Street Mailing Address
- Your Phone Number (including Area Code)
- Indicate which predictions program you are requesting
- The location(s) you want control files for
There is a fee for copies of these programs and for control files for different stations. These fees are recalculated every 2 years, so we will not list them in this here.
You may want to consider an alternative resource for predictions programs. There are several systems provided by academic and oceanographic organizations, which provide such software available for download and are portable to different systems.
A few examples of the many available online:
There are several products, publications, and services which may assist you:
- The CO-OPS Data API and the API Builder provide a means through which your application can obtain predictions directly from NOAA; rather than generating the predictions independently.
- Publication: NOAA Special Publication NOS CO-OPS 3 - Tidal Analysis and Predictions provides information on the analysis and prediction of tides, including the mathematical formulas for producing predictions.
- Publication: Special Publication No. 98: Manual of Harmonic Analysis and Prediction of Tides provides detailed descriptions of the analysis and predictions formulas, and their derivations.
- Publication: Special Publication No. 98 Supplement: Computer Application to Tides in the National Ocean Survey describes the methods that NOS uses to predict tides. The booklet contains sample algorithms for tidal data analysis and tidal predictions.
- Tide predictions and tidal current predictions software, described in the question above, are available upon request.
- Tidal Harmonic Constants used to mathematically generate tide predictions, and the Tidal Datums used to correct those results to a desired reference datum.
- Subordinate station adjustments: the adjustments applied to generate predictions for subordinate stations from a designated harmonic station predictions. These are referred to as “Table 2” files and are available upon request.
You can discuss your request or obtain any of the products listed above by calling our office at (301) 713-2815 between 7AM-3PM Eastern Time. You may also request these products by submitting a request to our e-mail address at Tide.Predictions@noaa.gov
If you elect to submit your request via e-mail, include the following information:
- Your Full Name
- Your Street Mailing Address
- Your Phone Number (including Area Code)
- The Information you want provided
There is a fee for these products not obtained through our online systems. These fees are recalculated every 2 years, so we will not list them here.
NOAA's National Ocean Services (NOS) ceased producing the annual Tide Tables and Tidal Current Tables. The 2020 edition was the last edition provided.
These publications have been replaced by online predictions services:
- NOAA Tide Predictions service
- NOAA Current Predictions service
The titles of the NOAA, NOS publications affected are:
Tide Tables:
- East Coast of North and South America including Greenland
- West Coast of North and South America including the Hawaiian Islands
- Central and Western Pacific Ocean
- Europe and West Coast of Africa including the Mediterranean Sea
Tidal Current Tables:
- Atlantic Coast of North America
- Pacific Coast of North America and Asia