- Extreme Water Levels
- Alabama
- Alaska
- California
- Connecticut
- Delaware
- Florida
- Georgia
- Hawaii
- Louisiana
- Maine
- Maryland
- Massachusetts
- New Jersey
- New York
- North Carolina
- Oregon
- Pennsylvania
- Rhode Island
- South Carolina
- Texas
- Virginia
- Washington
- Washington DC
- Island Stations
- Station Comparisons
- User's Guide
-

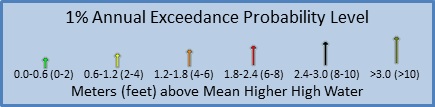
Extreme Water Levels
Please click on an arrow to access information about that station.
About
Extreme water levels are an important public concern and a factor in coastal hazard assessment, navigational safety, and ecosystem management. Extreme events range from more frequent, minor high tide flooding to less frequent, but severe storm surge from hurricanes and coastal storms.
The Extreme Water Levels Product provides results of extreme value analyses for 125 NOAA tide gauges locations with at least 30 years of water level data. Users can also view seasonal variations in exceedance probability levels and relate those levels to different tidal datums. When paired with real time station data, exceedance probability levels can be used to evaluate current conditions and determine whether an extreme event is occurring. This information can also be used to support a variety of coastal planning and decision-making activities. Results of the analyses provided in this product are available for download via CO-OPS Derived Product API.
A Note on Methodology
The extreme water levels provided in this product are a combination of the astronomical tide, storm surge, and limited wave setup caused by breaking waves. They do not include wave runup, the movement of water up a slope. Therefore, the 1% annual exceedance probability levels provided in this product do not necessarily correspond to the Base Flood Elevations (BFE) defined by the Federal Emergency Management Administration (FEMA), which are the basis for the National Flood Insurance Program (NFIP). To learn more about the methodology and data used in this product see NOAA Technical Report Extreme Water Levels of the United States 1893 - 2010.
Frequently Asked Questions
- What are Sea Level Trends?
- Why does Sea Level change over time?
- What does Sea Level have to do with Climate?
- What are Exceedance Probability Statistics?
- What do the 1%, 10%, 50%, and 99% annual exceedance probability levels in this product represent?
Data and Resources
- NOAA Technical Report NOS CO-OPS 67, "Extreme Water Levels of the United States 1893-2010".
- NOAA Technical Report NOS CO-OPS 53, "Sea Level Variations of the United States 1854-2006".
- "Response of Extreme Storm Tide Levels to Long-term Sea Level Change", Chris Zervas, CO-OPS, NOAA/National Ocean Service.
- Coastal flooding terms as defined by FEMA.
- Statistics of Weather and Climate Extremes, National Center for Atmospheric Research (NCAR) website.
- "Analyzing Seasonal to Interannual Extreme Weather and Climate Variability with the Extremes Toolkit", Eric Gilleland and Richard W. Katz, Research Applications Laboratory, NCAR, Boulder, CO.
- "Extremes Toolkit: Weather and Climate Applications of Extreme Value Statistics", a tutorial by Eric Gilleland and Richard W. Katz, NCAR.
- R Programming Language, a free software environment for statistical computing and graphics which compiles and runs on a wide variety of platforms.