Harmonic Analysis
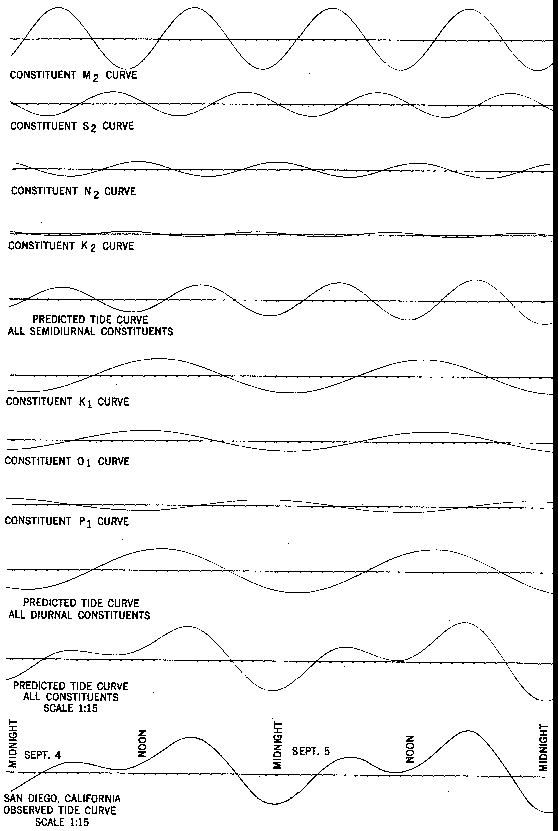
The mathematical process by which the observed tide or tidal current at any place is separated into basic harmonic constituents. Even without resorting to a mathematical discussion, one can readily see this process in the graphic below. The observed tide curve at San Diego (bottom curve on the graphic) can be decomposed into all of its diurnal constituents (K1, O1,P1) and all of its semidiurnal constituents (M2, S2,N2, K2). By graphically adding the semidiurnal and diurnal signals one can reconstruct a very close approximation of the original observed tide curve.
This is shown in three steps. First, you can see "all semidiurnal constituents" added together in the 5th curve from the top of the graphic. Second, you can see "all diurnal constituents" added together in the 3rd curve from the bottom of the graphic. Finally, you can see "all constituents", diurnal and semidiurnal, added together in the "predicted tide curve" which is the second to last curve on the graphic. You can see that this predicted curve quite closely matches the originally observed tide curve at San Diego.
-

Harmonic analysis at San Diegeo