High Frequency Radar Surface Currents
What is High Frequency (HF) Radar?
What HF Radar Data does CO-OPS display?
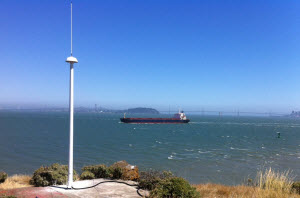
The CO-OPS HF Radar Surface Current product displays both near real time surface current observations and surface tidal current predictions. Presently, CO-OPS displays observations and predictions from San Francisco Bay, Chesapeake Bay and New York Harbor though additional locations may be added in the future. For observations from other HF Radar locations please see the National Network site.
Observations
The observed HF Radar currents are hourly averages of the surface current speed and direction for the past 48 hours. The time average typically occurs centered on the hour - for example, data with a timestamp of 12:00 indicates that the observations were collected and averaged from 11:30 to 12:30. Each map grid point represents the average current over a spatial area depending on the HF Radar resolution (e.g. at Chesapeake Bay each point represents an area of 2 km x 2 km). These data are collected from the National Network and quality control is performed prior to CO-OPS receiving the data. CO-OPS does not archive data beyond 48 hours old. To view archived data please see the National Network site or the National Data Buoy Center (NDBC) site.
Tidal Current Predictions
The predictions shown at each grid point are the predictions of the speed and direction of the tidal component of the surface current at that location. The predictions were calculated by performing a harmonic analysis for one year of the observed HF Radar surface currents at each grid location. These values represent only the tidal portion of the surface current - other factors that influence the currents (e.g. wind, water density differences) are not included in this prediction.
Level of Uncertainty in HF Radar Observations and Predictions
Both the HF Radar observed and predicted surface currents have some
amount of uncertainty in the accuracy of the values presented.
For the observed surface currents, although the precise
amount of error is difficult to quantify, HF Radar data is generally
expected to be accurate to within 10 cm/s of current speed and 10
degrees of current direction. It is important to note, that the
presented values are spatial and time averages - so that they may not
be representative of the currents of a specific point within a grid
cell (particularly near shore) or of an instant in time during the
observed hourly period.
Uncertainty in the accuracy
of the predictions is much greater. For most locations the primary
source of differences between the predicted and observed surface
current will be wind forcing (though water density differences can
also be important). Depending on local meteorological conditions the
actual speed and direction of the surface current at a particular
location can be dramatically different than predicted.
Differences from NOAA Tidal Current Tables
It is expected that there will be differences between the HF Radar Surface Current predictions and the current predictions in the NOAA Tidal Current Tables (TCTs). There are numerous reasons for these differences including: The predictions in the TCTs are from data collected at depth, while the HF Radar predictions are from data collected at the surface; The predictions in the TCTs are collected at a single point, whereas the HF Radar predictions are spatial averages over kilometer(s); and the predictions in the TCTs are typically based on 6 minute averages of the currents, whereas the HF Radar predictions are based on hourly averages.